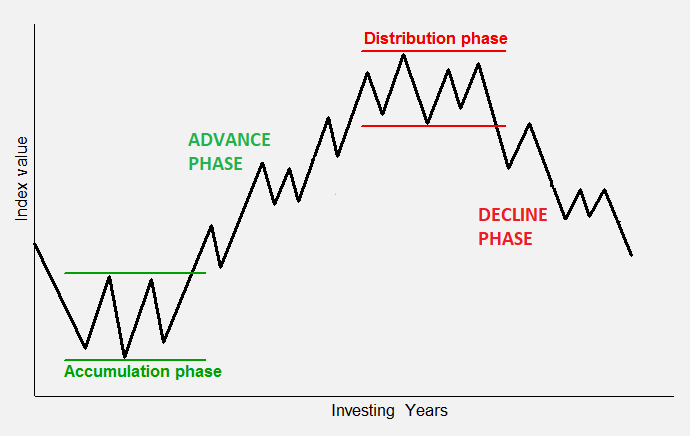
Importance of chart pattern / How charts are useful in Trading ?
Study of chart pattern helps to do time projections , and with combination of average crossovers and momentum indicators like RSI and other Indicators , we initiate buy and sell positions as and when the triggers are achieved based on set criteria’s . Study of charts can be done taking multiple time frames into considerations .
There are reversal patterns and continuation chart patterns that have been identified and are available for observation in stock market . A reversal pattern signals that a prior trend will reverse on completion of the pattern . conversely , a continuation pattern indicates that the prior trend will continue onward upon the pattern’s completion .
There are few charts pattern explained here for the basic knowledge .
Head and shoulder pattern
Inverted head and shoulder pattern
Double top pattern
Double bottom
Symmetrical triangle pattern
Ascending triangle pattern
Descending triangle pattern
Flag pattern
The pennant
Wedge
by studying and using such pattern ,traders can get signals for timely entry , and also calculate price projections .

Importance of indicators –
Main aim of a trader is to find stocks which are about to rise or fall with momentum , and not the stock that already are in momentum . The difference here is that the stocks that already are in momentum may not give you a fresh entry point , whereas by spotting a stock that can rise with momentum , would give you a timely entry point , and by doing so you can make the most of that momentum in given time horizon and exit with descent profit as calculated.
Indicators are the important tools for spotting a good entry point .
As a trader one must know the following when you consider buying or selling a stock ?
Is the stock trending or consolidating ?
If trend is established , what is the strength of that trend ?
How is the momentum ?
At what point you can confirm that the momentum will increase ?
At what point you can say that the momentum has decreased ?
Are you getting any trend reversal signal ?
How volatile is the stock ?
What is the volume indicating ?
With the help of different indicators the above questions can be easily answered . there are many indicators in market which serve different purposes as formulated .
Some indicators are leading indicators and some are lagging indicators . In generally the fact is that most indicators are lagging indicators . Some indicators are used to know , momentum , some indicate trend , and there are indicators that can show us the strength of trend and some indicators can help us to get trend reversal signals .
Some of the common indicators are –
RSI ( Relative Strength Index )
Stochastic
MACD ( Moving Average Convergence Divergence )
ADX
Bollinger Bands
Moving average
Never take decision based on a signal received from a single indicators . only take decision are taken after observing single from more than one indicators ..
Moving Average is an important tool that we will use technical analysis study .
Importance of volume –
Study of volume is a must . Volume can help determine the strength of an existing trend . A strong up – trend should have higher volume on the upward legs of the trend and lower volume on the downward legs . similarly , strong downtrends usually have higher volume on the downward legs of the trend and lower volume on the upward pullbacks .
How does volume gives the trend reversal or trend continuation signal ?
When trend reversal signal is received by volume ?
Usually trend reversal signal is received when ,
Above average volume is registered with very little price movement .
Above average volume is registered after a huge advance or decline .
When trend continuation signal is received ?
Usually trend continuation happens when ,
Above average volume is registered with strong price movement .
Above average volume is registered during a positive breakout .
Below average volume is registered with no price movement .
By combining other tools like fibonacci number , importance of pivot point can help us in taking good decision when it comes to deciding whether a trade must be initiated or not .
Importance of candlesticks :
Japanese candlesticks can be very effectively used to spot important trend reversals , trend continuation . It is used in japan since centuries , and now widely used by traders worldwide .
Candlesticks are usually more appealing and information revealing . the information conveyed by the candlesticks is much accurate than the chart .there are many candlesticks pattern like hammer , inverted hammer, bearish engulfing etc .
We can go long or short depending on the characteristics of such candles .
Candles are represented by different colours..
Green candle means bullish because the stock price increases during the period . In some software’s the bullish candle is white instead of green .
Red candle means bearish because the stock price decrease during the period .In some software’s the bearish candle is black instead of black .
The hollow portion i.e. either of Green/white or red/black colour is called body of the candle which represents the opening and closing price . The long thin line above and below the body is known as Shadows or Tails , which represent the day high or low price . Candle can be vary in size depending on the volatility on a particular day . Candlesticks are visually more appealing , and help us to interpret chart better


